Market Data Bank

Click image to enlarge
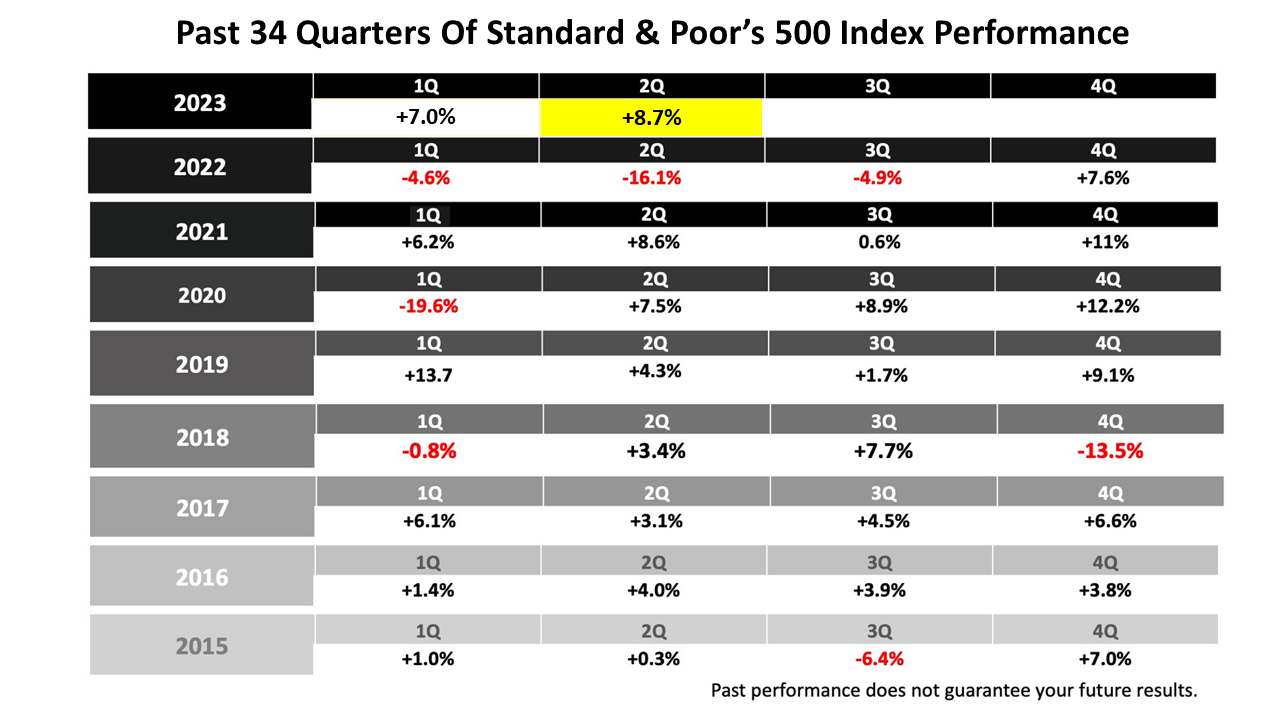
For the third consecutive quarter, U.S. stock returns were extremely strong in the second quarter ended June 30, 2023.
The Standard & Poor’s 500 stock index gained +8.7%, following a +7.5% gain in the first quarter of 2023 and +7.6% gain in the fourth quarter of 2022.
Click image to enlarge
Keep in mind, the three very strong quarters were preceded by three quarters of losses in the first, second, and third quarters of 2022.

Click image to enlarge
At the end of the quarter, the S&P 500 was only about 7% lower than its all-time high on January 3rd, 2022.
From its record high, the S&P 500 began a 10½-month plunge.
The benchmark index dropped into bear market territory in June 2022, when it closed more than 20% lower than its peak.
The bear market bottomed in mid-October 2022, when the current upturn in stock prices began.
On June 10, 2023, the stock market closed more than 20% higher than its October 2022 low, marking the end of the bear market and the beginning a new bull market cycle.

Click image to enlarge
The new bull market that began June 10 has broadened noticeably. More companies are participating in the bull market’s gains. Increased bull market breadth is a positive sign.
The largest eight companies in the Standard & Poor’s 500 stock index have dominated stock market performance since mid-March.
The market-cap-weighted S&P 500 index diverged from the equal-weighted S&P 500 index beginning from mid-March through the end of May.
That was when technology giants Apple, Microsoft, Amazon, NVIDIA, Tesla, Alphabet (Google), and Meta (Facebook) began to rally and pulled away from the other 492 companies in the S&P 500 index.
However, since June 1, the other companies in the S&P 500 index have begun to close the performance gap, as shown in the chart comparing the market-capitalization-weighted S&P 500 to the equal-weighted version of the index.

Click image to enlarge

Click image to enlarge

Click image to enlarge

Click image to enlarge

Click image to enlarge
The economy and stock market were stronger than expected in the 12 months through June 2023.
In March 2022, the Federal Reserve began the most aggressive monetary tightening campaign in modern history, raising rates 10 times in 15 months.
The stock market rose anyway! In fact, it boomed!
The S&P 500 returned +19.6% in the 12 months ended June 30, 2023.

Click image to enlarge
All quarter long, the economists surveyed by Blue Chip Economics hiked their growth forecasts in the second quarter of 2023.
The consensus forecast was for the economy to shrink slightly as recently as of April 6th.
But economists surveyed as of July 5th raised their projection steadily and by a surprising amount.
To be clear, after predicting the economy would shrink by a fraction in early April, economists raised their forecast as of July 5 to a 1.3% growth rate in the second quarter.
In three months, the forecast for the quarterly growth rate was raised by 1.4 percentage points.
The gross domestic product of the United States is about $23 trillion, making a 1% increase worth $230 billion.
A 1% increase in GDP growth per capita, in dollar terms, is equal to another $720 of GDP per person.

Click image to enlarge

Click image to enlarge

Click image to enlarge

Click image to enlarge

Click image to enlarge
After trading sideways for approximately two years in 2015 and most of 2016—and hitting two air pockets—the stock market broke out of its range after the November 2016 election.
The S&P 500—a market capitalized weighted index—rose steadily to an all-time peak on September 20, 2018, whereupon it plunged -20% on investor fears that an inverted yield curve was imminent.

Click image to enlarge

Click image to enlarge

Click image to enlarge
For the five years ended June 30, 2023, the U.S. stock market outperformed major regional foreign stock markets across the globe.

Click image to enlarge
Compared to the diverse list of 12 assets shown here, the U.S. stock market outperformed by a wide margin in the five years through the end of June 2023.

.png)
